All projects
Public data setFinancial analysis
Revenue and Cost Performance Analysis
Two years of sales invoices from the public Adidas sales sample data set, modeled in Excel and Power BI to answer management questions on revenue, cost and profit.
Oct 2023Power BIExcelPower QueryPower PivotData modeling
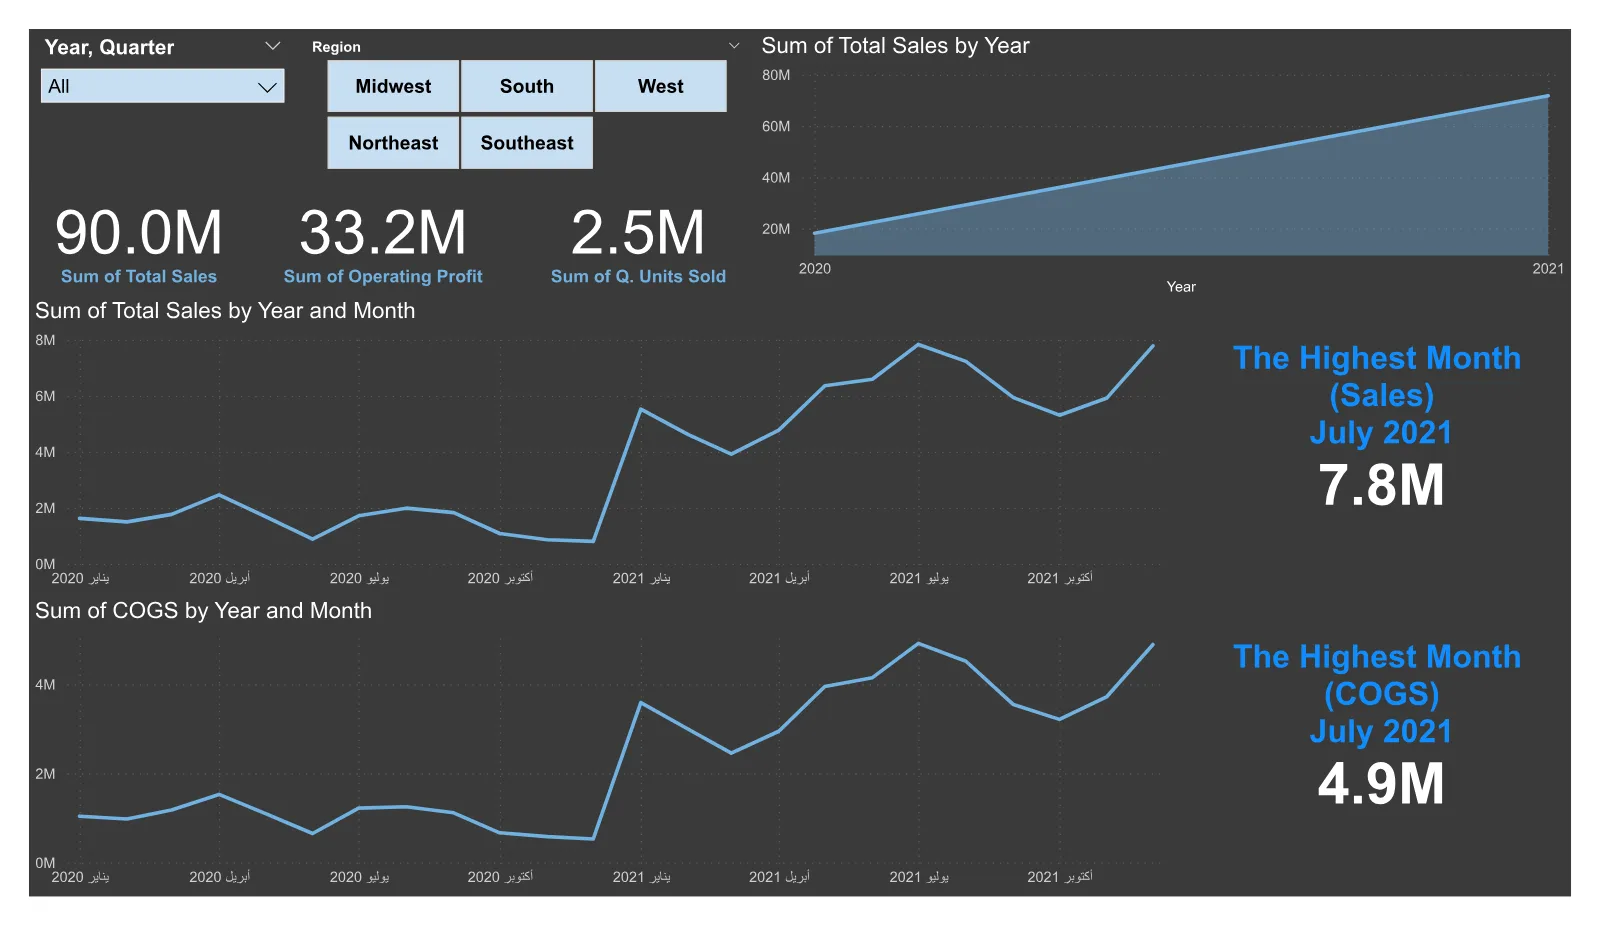
Open the live dashboard- $90.0m
- total sales
- $33.2m
- operating profit
- 2.48m
- units sold
- 9,648
- invoices
Revenue and Cost Performance AnalysisReal data
1Problem
Revenue and expense data across months was available, but it did not answer the questions management asks: where is the money coming from, where is it going, and what changed.
2Data
- Public Adidas US sales sample data set, published online: 9,648 invoices for 2020 and 2021. It is sample data, not client data.
- Retailer, region, state, city, product, sales method, units, price, total sales and operating profit.
3Approach
- 01Understood the data and fixed missing values and wrong data types.
- 02Queried the data in Power Query and added calculations such as COGS and product gender.
- 03Modeled it in Power Pivot with measures for sales, cost, profit and units.
- 04Answered the questions with pivot tables: totals, best and worst months, monthly change, top states and comparisons.
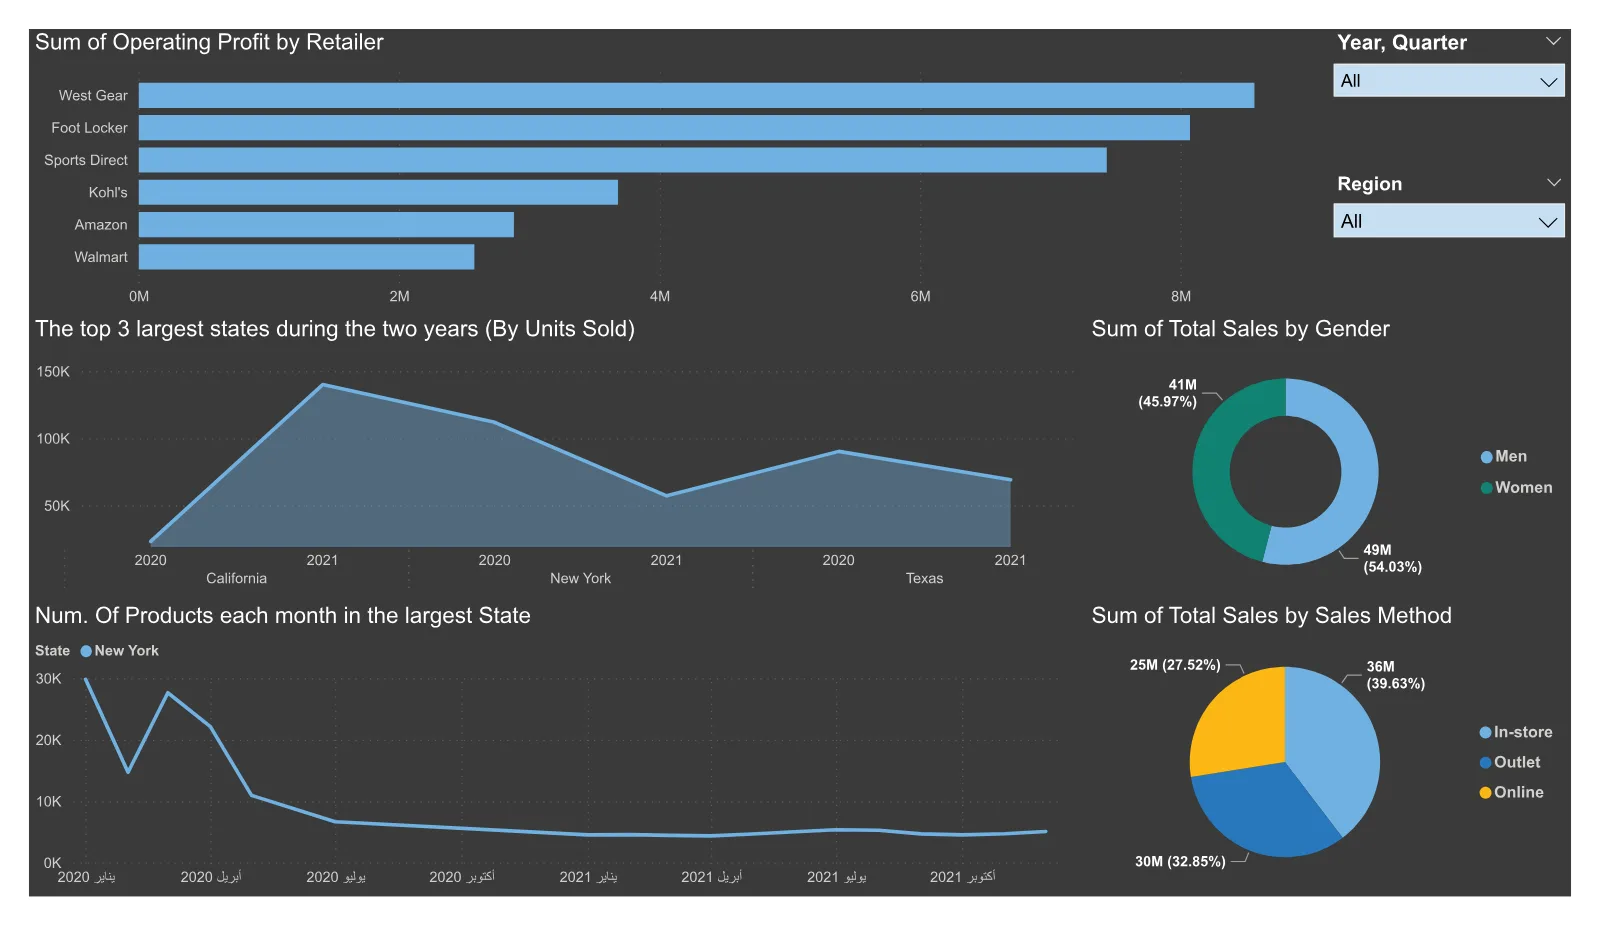
- 05Built a two-page Power BI dashboard with year, quarter and region slicers.
4Key insights
- Total sales of $90.0m, operating profit of $33.2m (36.9% margin) and 2.48m units sold.
- 2021 delivered 79.8% of the two-year sales. July 2021 was the peak month for both sales ($7.8m) and cost ($4.9m).
- In-store brings the most revenue (39.6%), but Online sells the most units (939k) and has the best margin: 39.0% against 35.8% in-store.
- The West is the largest region with $27.0m. Men’s Street Footwear is the top product at $20.9m.
- Men’s products generate 54% of sales.
5Result
- Monthly trends for revenue and cost in one model.
- Direct answers to management questions, ready for data-driven decisions.
- A Power BI dashboard that can be filtered by period and region in seconds.
Screens